HUMIDITY VS. LATITUDE
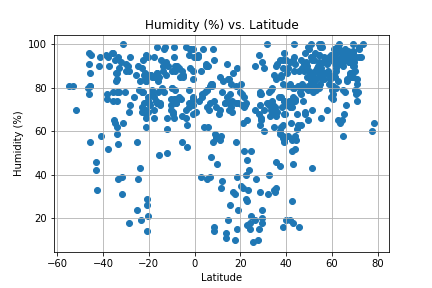
Around the equator the humidity for each city appears to cluster around the 60% to 80% range. There are some lower humidity outliers but the majority apperas to be of a high %. This shows visually that the closer a city is to the equator the higher the humidity.
HUMIDITY (Northern & Southern Hemisphere) VS. LATITUDE
.png)
.png)
A moderate correlation was identified in the Northern Hemisphere between humidity and distance to the equator. A very low correlation was identified for the Southern Hemisphere. Overall I would say it was a weak to medium strength correlation for humidity to latitude to the equator.
VISUALIZATIONS
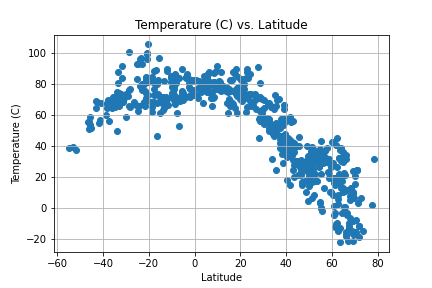
Temp vs Latitude
Humidity vs Latitude
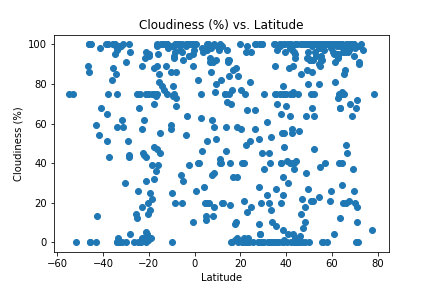
Cloudiness vs Latitude
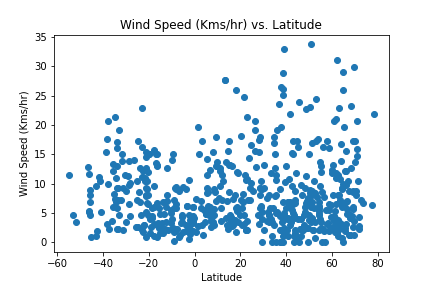
Wind speed vs Latitude